The Battery Benchmark Circuit v8.0, or BBC v8.0, to keep it short, is an upgraded and extended version of my previous BBC v3.0 (that can be seen here). The BBC v8.0 is used by the McMaster Solar Car Project to benchmark the discharge of 8 lithium polymer battery cells simultaneously. We need to test individual cells to determine if they conform to the datasheet specifications from our supplier (to see if what we paid for is what we received) and is also used to “cherry pick” cells for our race pack. The previous Battery Benchmark Circuit I built for the team worked very well but was only 1 channel. This was fine for testing battery samples, but it would take approximately 120 hours to test our complete set of cells. The BBC v8.0 will complete the same test in only 15 hours, increasing measurement accuracy by ~2x. Even though the BBC v8.0 took almost 100 hours to design and build it will hopefully be used by the team for future battery pack analysis. I created the BBC v8.0 to take advantage of input/output modules, this made the circuit design and physical etching of the circuits less complicated and allowed for the testing of each module separately.
Below, you will find everything from schematics to the final build photos.
Specifications
- 12bit ADC (4096 steps)
- 8-channel voltage input (0-5V)
- 8-channel current input (0-50A)(Fully Isolated)
- 8-channel output relay control (15V)
- USB output (USB to Serial)
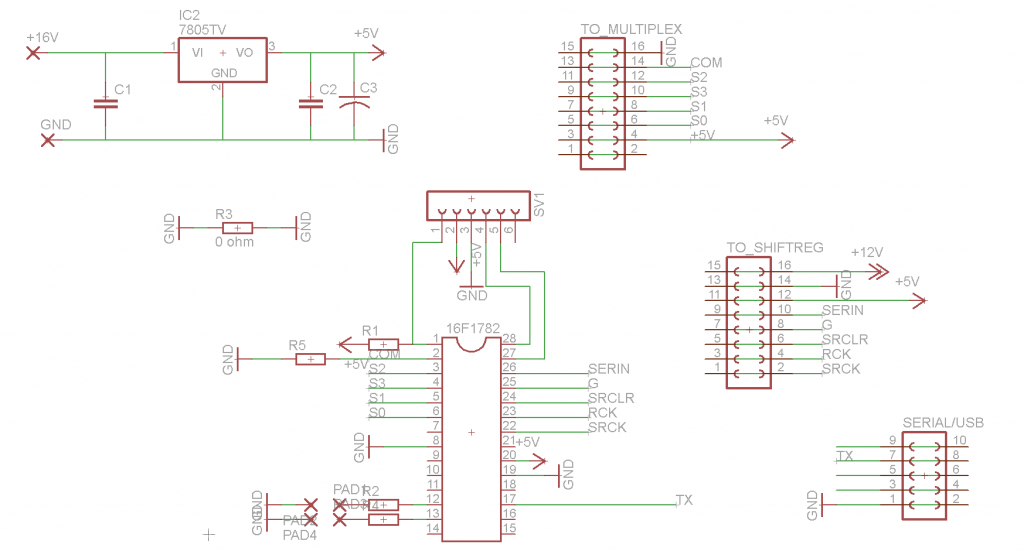
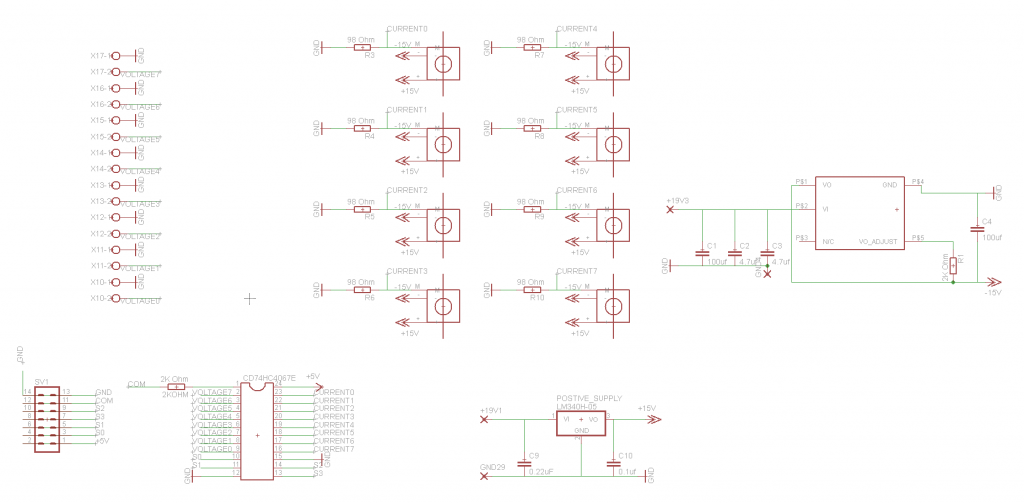
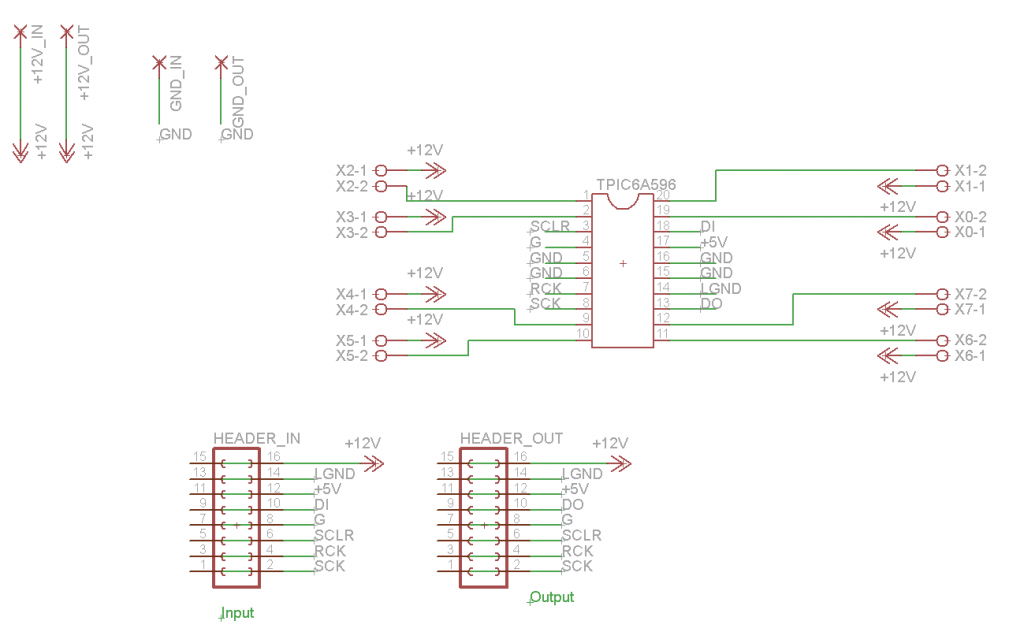
- 4 separate control boards for easy repairs and upgrades (Brain, USB to Serial, Multiplexer Board, Shift Register Board)
Schematics
The following schematics were created in Eagle 5.0
Board Design
The following board designs were created in Eagle 5.0
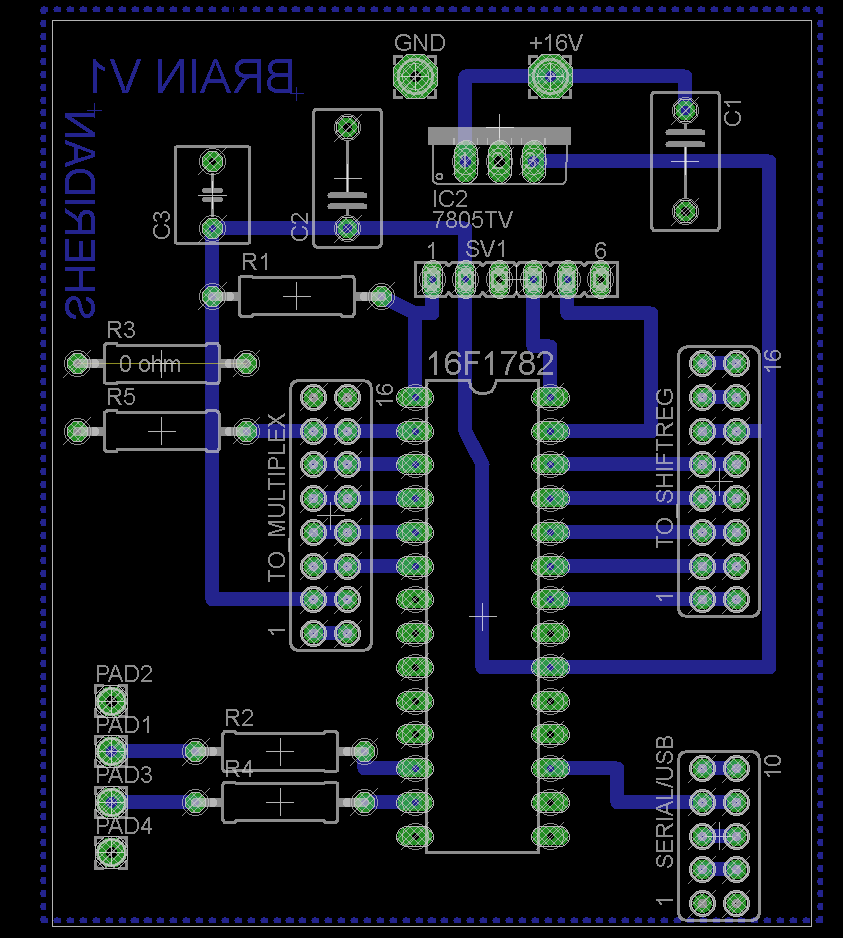 Brain Board
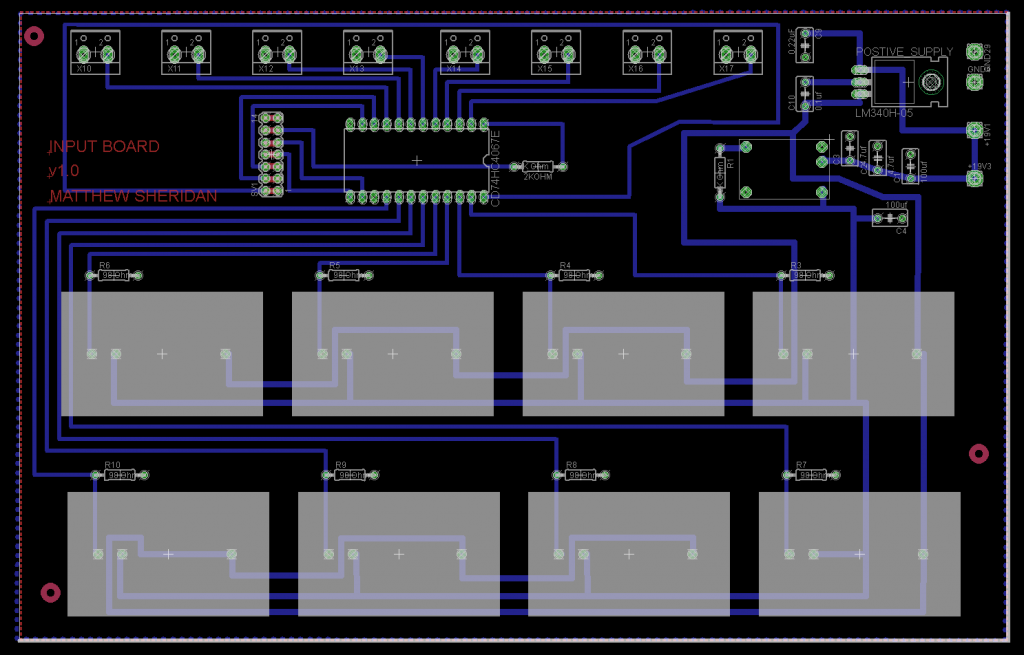 Multiplexer Board
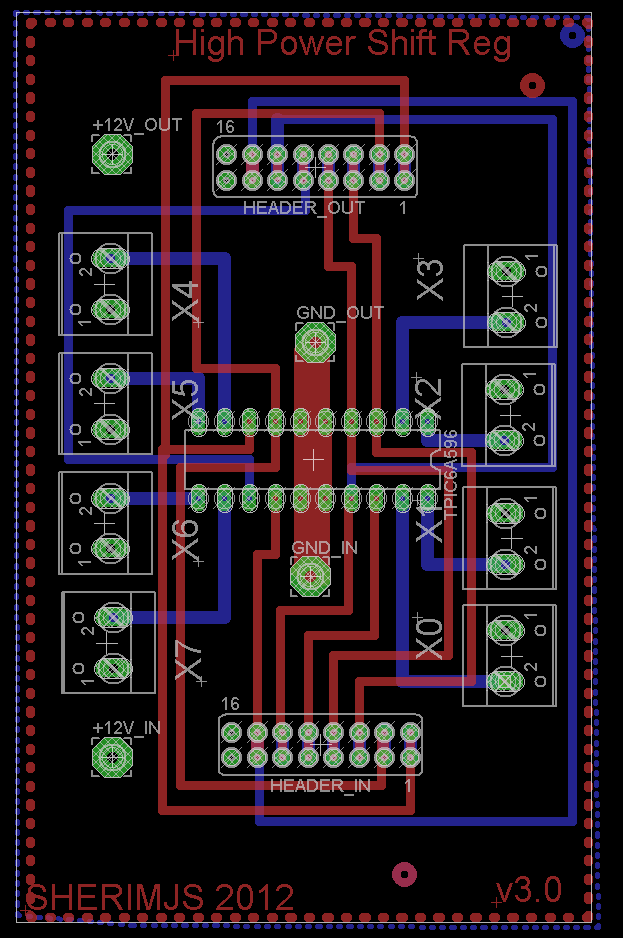 Shift Register Board
The Build
The build process was much more complicated than initially expected and took over 100 hours. A large chunk of this time was used in etching and drilling of the prototypes, this took a lot longer then expected because I worked completely out of my student house and the circuits were more complex then I initially planned them to be. Below, you can see photos of the etching process as well as the assembly of the rack mount enclosure.
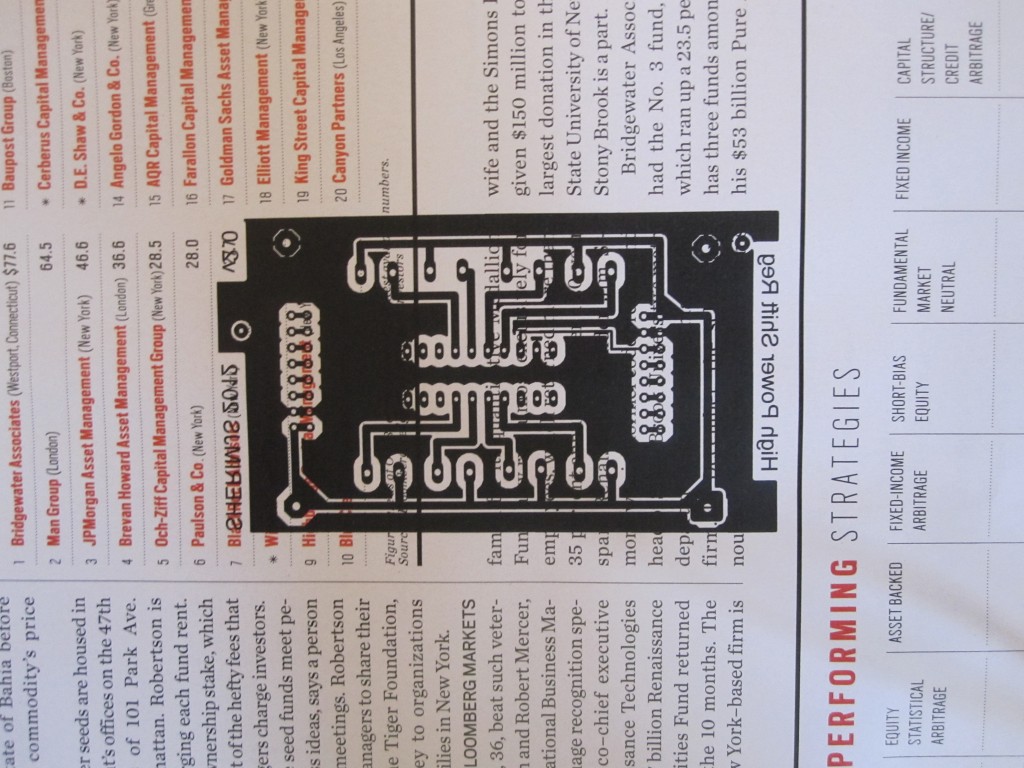 The board to be etched is printed on glossy magazine paper using a black-and-white laser printer.
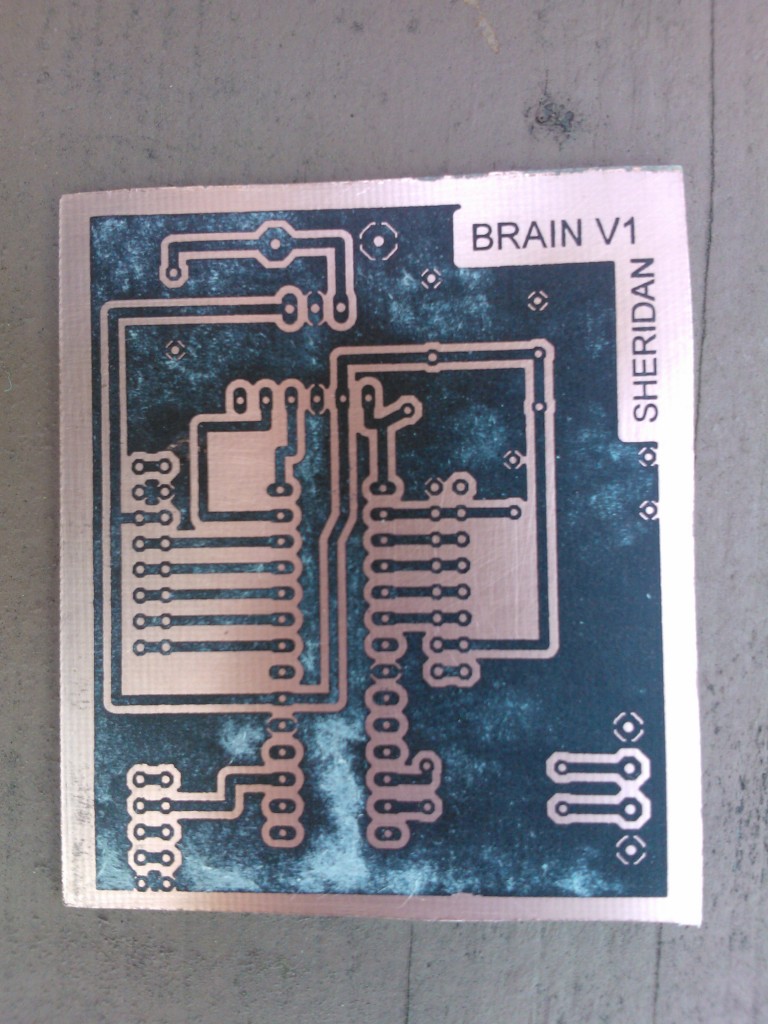 The magazine paper is ironed onto prepped copper clad board and then the paper is dissolved with warm water leaving the toner fused to the copper clad. (not the same circuit as the previous photo)
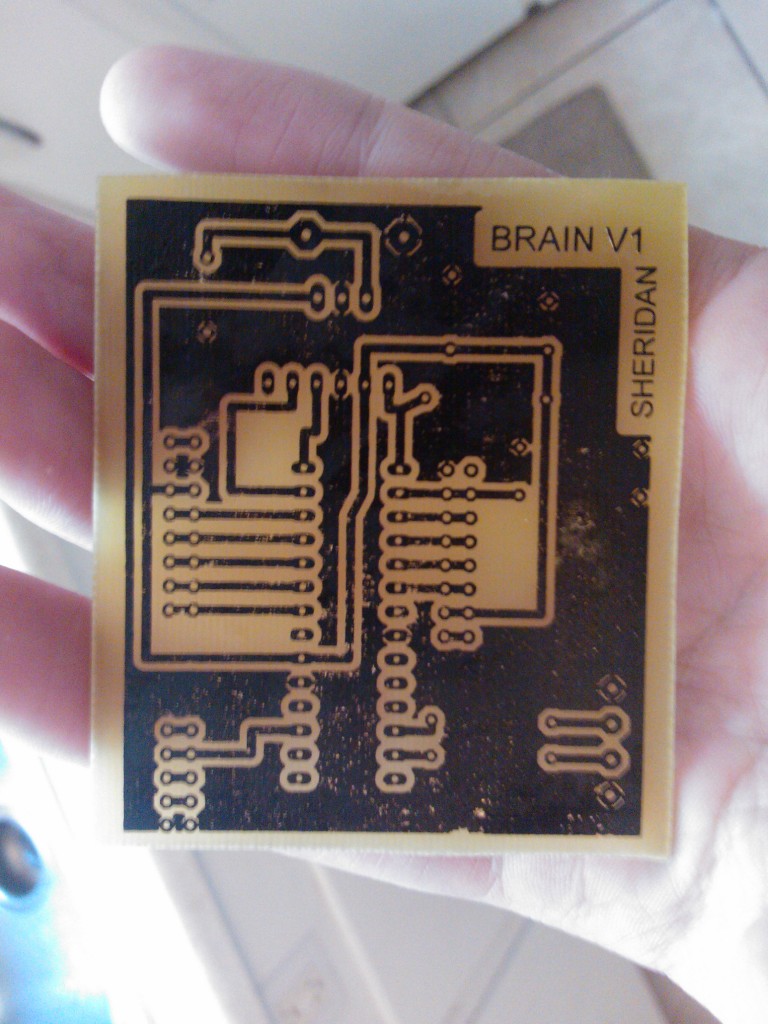 The exposed copper is etched away using ferric chloride, leaving the protected copper behind.
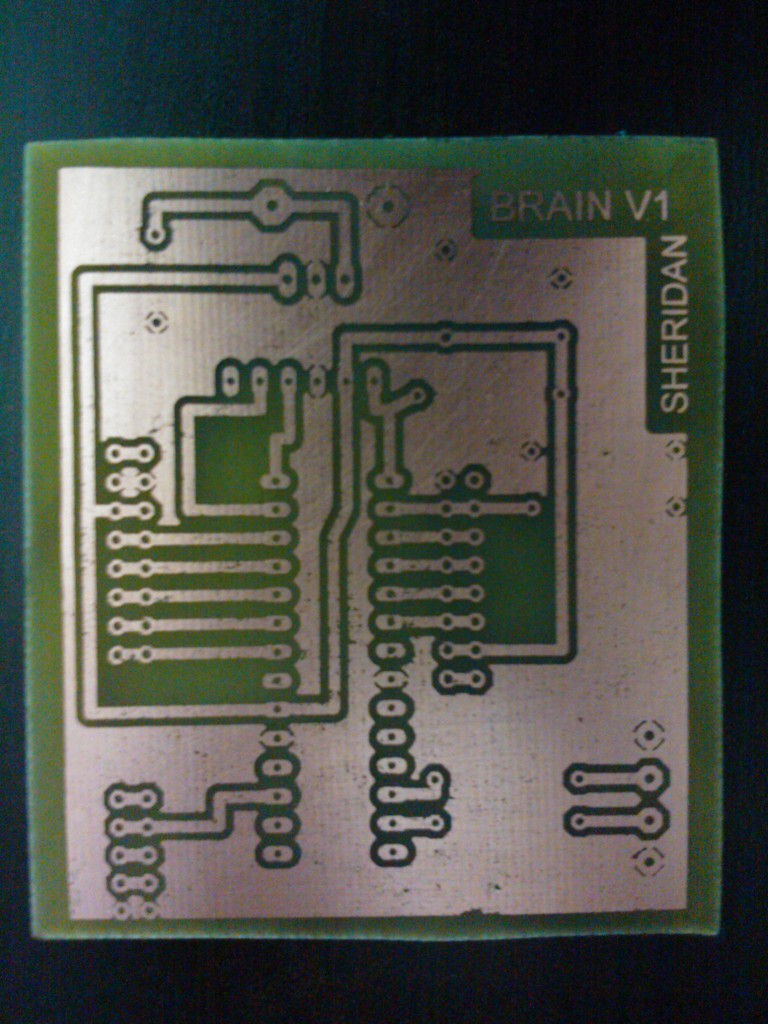 The toner is removed using acetone, exposing the remaining copper.
 The PCBs are drilled, and components are soldered into position. The boards are then placed in the rack mount enclosure. You can see the 8 relays at the top of the photo and the 16 sets of binding posts at the bottom. The board at the top left is the USB to Serial board, the bottom left is the brain board, the middle board is the multiplexer board (input board) with 8 hall effect sensors (black rectangles), and on the right side of the enclosure is the shift register board (output board).
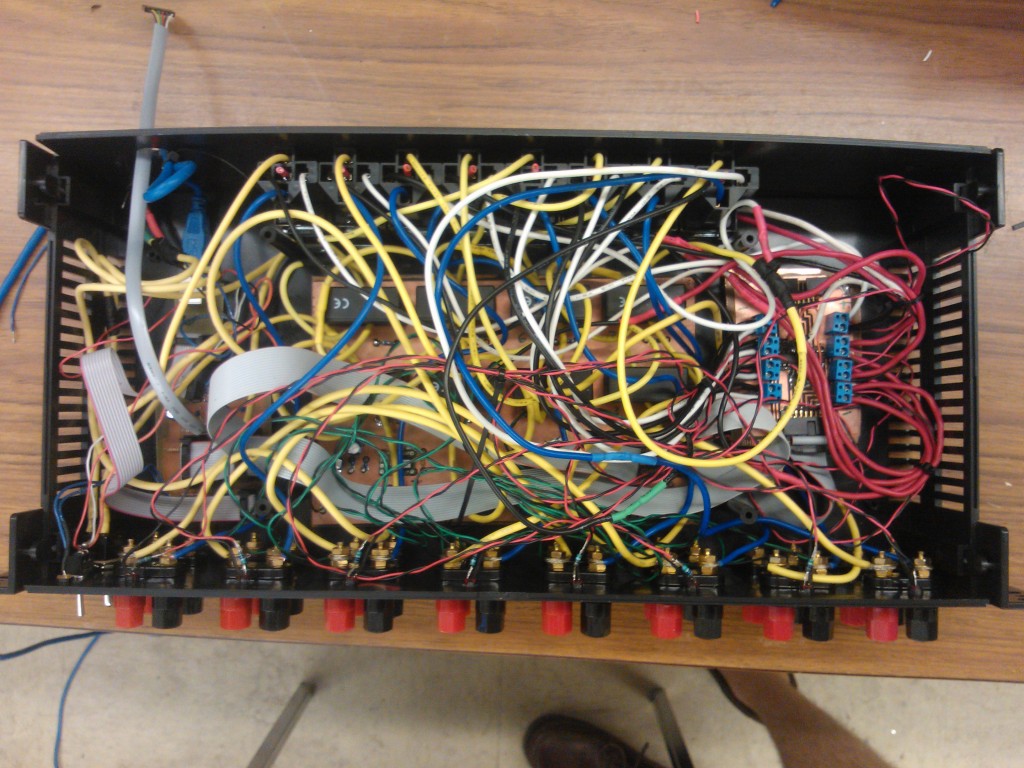 The control and input wiring are finished. Ribbon cables facilitate communication between boards.
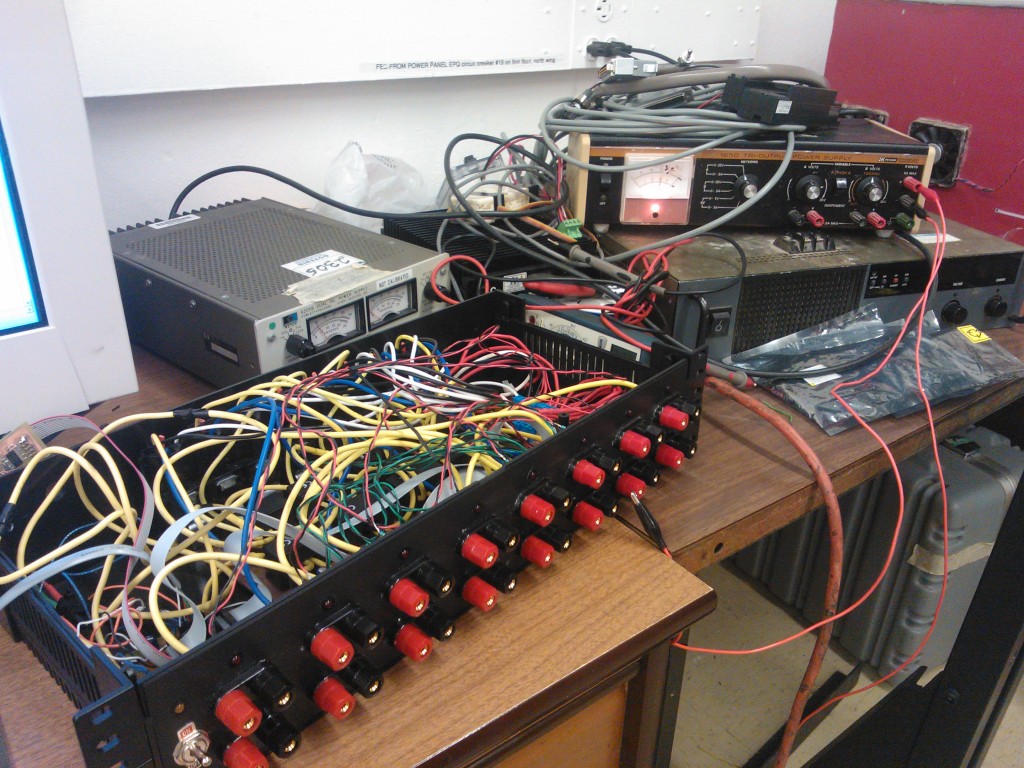 The completed BBC v8.0 (without lid) goes through a calibration test. (calibration data is stored on the PC side software to reduce computation time on the microcontroller)
Software
The software inside the BBC v8.0 performs a continuous 8-period moving average of voltage and current readings. This data is also continuously checked to ensure the system is safe (no high or low cell voltage, no over current), and the corresponding channel relays are activated or deactivated in response to this data. If a relay is activated (all safe conditions are met), the cell will begin to discharge through an external power resistor of proper size for the desired discharge level, and an LED will light above the corresponding channel to confirm the initialization of a discharge routine. As a discharge is taking place, the moving average of voltage and current measurements and the current elapsed time will be sent over the serial to the USB connection to the PC. An amber led above the main power switch will blink to signify this transmission. This data stream is logged on the PC side in a text file that will then be passed to an Excel routine that will integrate the power curve and return the realized capacity of the tested cells. Graphs of power vs. time and voltage vs time will also be produced for each cell being tested. An example of these graphs can be seen below.

To Do
- Finish calibration of all 8 channels
- Buy 8 new power resistors
- Finish PC live view code (first version seen below)

